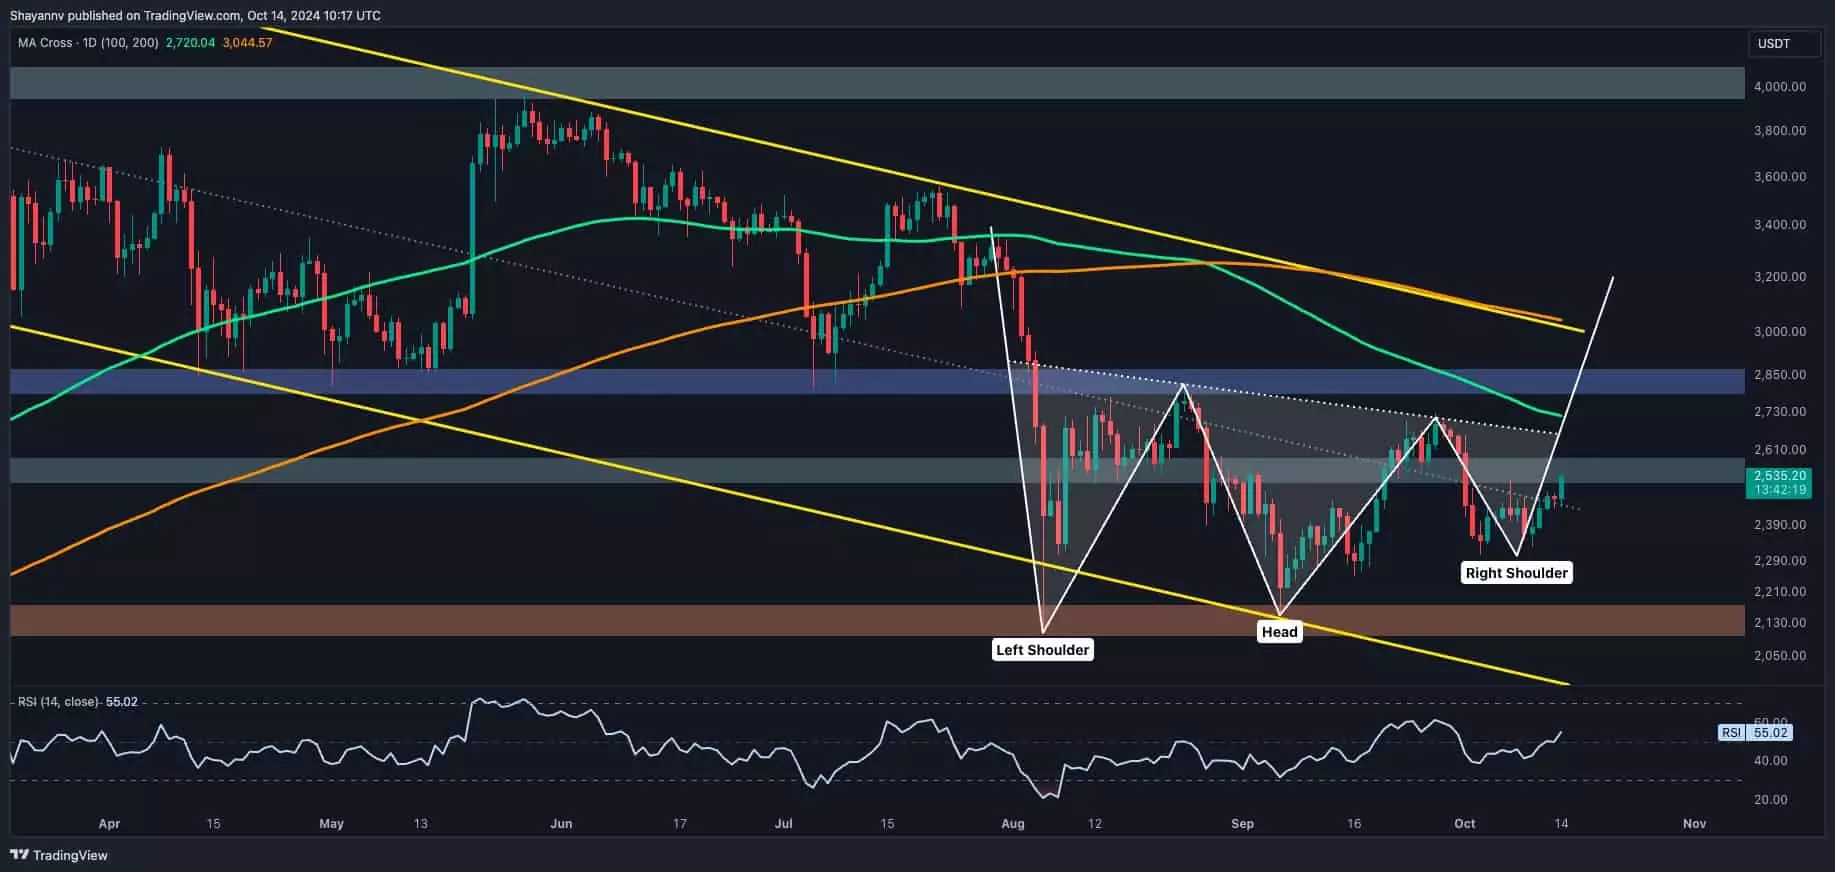
Ethereum is navigating through an intricate phase marked by critical patterns on its technical charts. Traders and market analysts alike are observing an inverted head and shoulders formation along with a double-bottom configuration, both of which suggest a potential bullish reversal in the near future. In this article, we will dissect these patterns while highlighting key price levels and the broader market dynamics that could influence Ethereum’s trajectory.
On the daily chart, Ethereum showcases a developing inverted head and shoulders pattern, pertinent for traders looking for bullish indicators. This pattern emerges when the price creates a lower trough, followed by a deeper trough (the head) and then another higher trough, completing the formation. The key neckline, currently positioned at approximately $2.7K, will be critical in determining whether buyers will gain control. If Ethereum manages to breach this neckline, it could signal the beginning of an upward momentum rally, potentially steering towards the $3K resistance mark.
As Ethereum has recently tested the $2.1K support level, this area has turned into a significant battleground for buyers and sellers alike. Persistence at this level indicates that buyers are not willing to surrender, setting the stage for a potential reversal should conditions prove favorable.
Zooming into the 4-hour chart, we observe an interesting double-bottom pattern, which typically hints at a bullish trend shift. This configuration arises when the price hits a level of support (in this case, around $2.3K) twice, with an intervening peak in between. Each test of support strengthens the position and resilience of buyers, leading to the possibility of a reversal if the price surmounts the preceding high.
The current price action is situated within the confines of an ascending flag pattern, with vital support demonstrated near $2.3K. This flag pattern signifies a phase of consolidation following a previous upswing. Thus far, sellers have been unable to push below this support, indicating a momentary stalemate. However, should the price break down below this boundary, traders may witness a swift move toward the $2.1K area, potentially igniting a long-squeeze scenario.
Evaluating the market landscape, specifically with insights from the Binance liquidation heatmap, adds further depth to the analysis. The heatmap delineates concentration zones of liquidity influenced by substantial market participants, particularly whales. For Ethereum, the $2K mark showcases a robust defensive line upheld by significant institutional investments. This concentration reflects the intent of larger traders to optimize their positions while minimizing risks.
Conversely, the $2.8K resistance area presents a formidable challenge, characterized by equally significant liquidity pools. The interplay of these liquidity zones means that a breakout—either upwards or downwards—could trigger a cascade effect of liquidations and stop-loss orders, amplifying the resulting price movement.
Currently, Ethereum is ensnared within a tight price range, oscillating between $2.1K and $2.7K. This environment of consolidation is indicative of a balance between buyers and sellers, with volatility remaining subdued as both factions await a trigger to propel the asset in a definitive direction. Until Ethereum can break free from this constrained range, traders are likely to experience limited price action.
Ethereum’s near-term outlook hinges on its ability to navigate the pivotal levels at $2.1K and $2.7K. The confluence of technical formations such as the inverted head and shoulders and double-bottom patterns, alongside the critical liquidity zones highlighted by market dynamics, presents an intriguing setup for traders. As the momentum shifts, participants in the market must remain vigilant, as either a bullish breakout or a bearish retracement from these key levels could set the stage for significant profit opportunities or unforeseen risks.


