
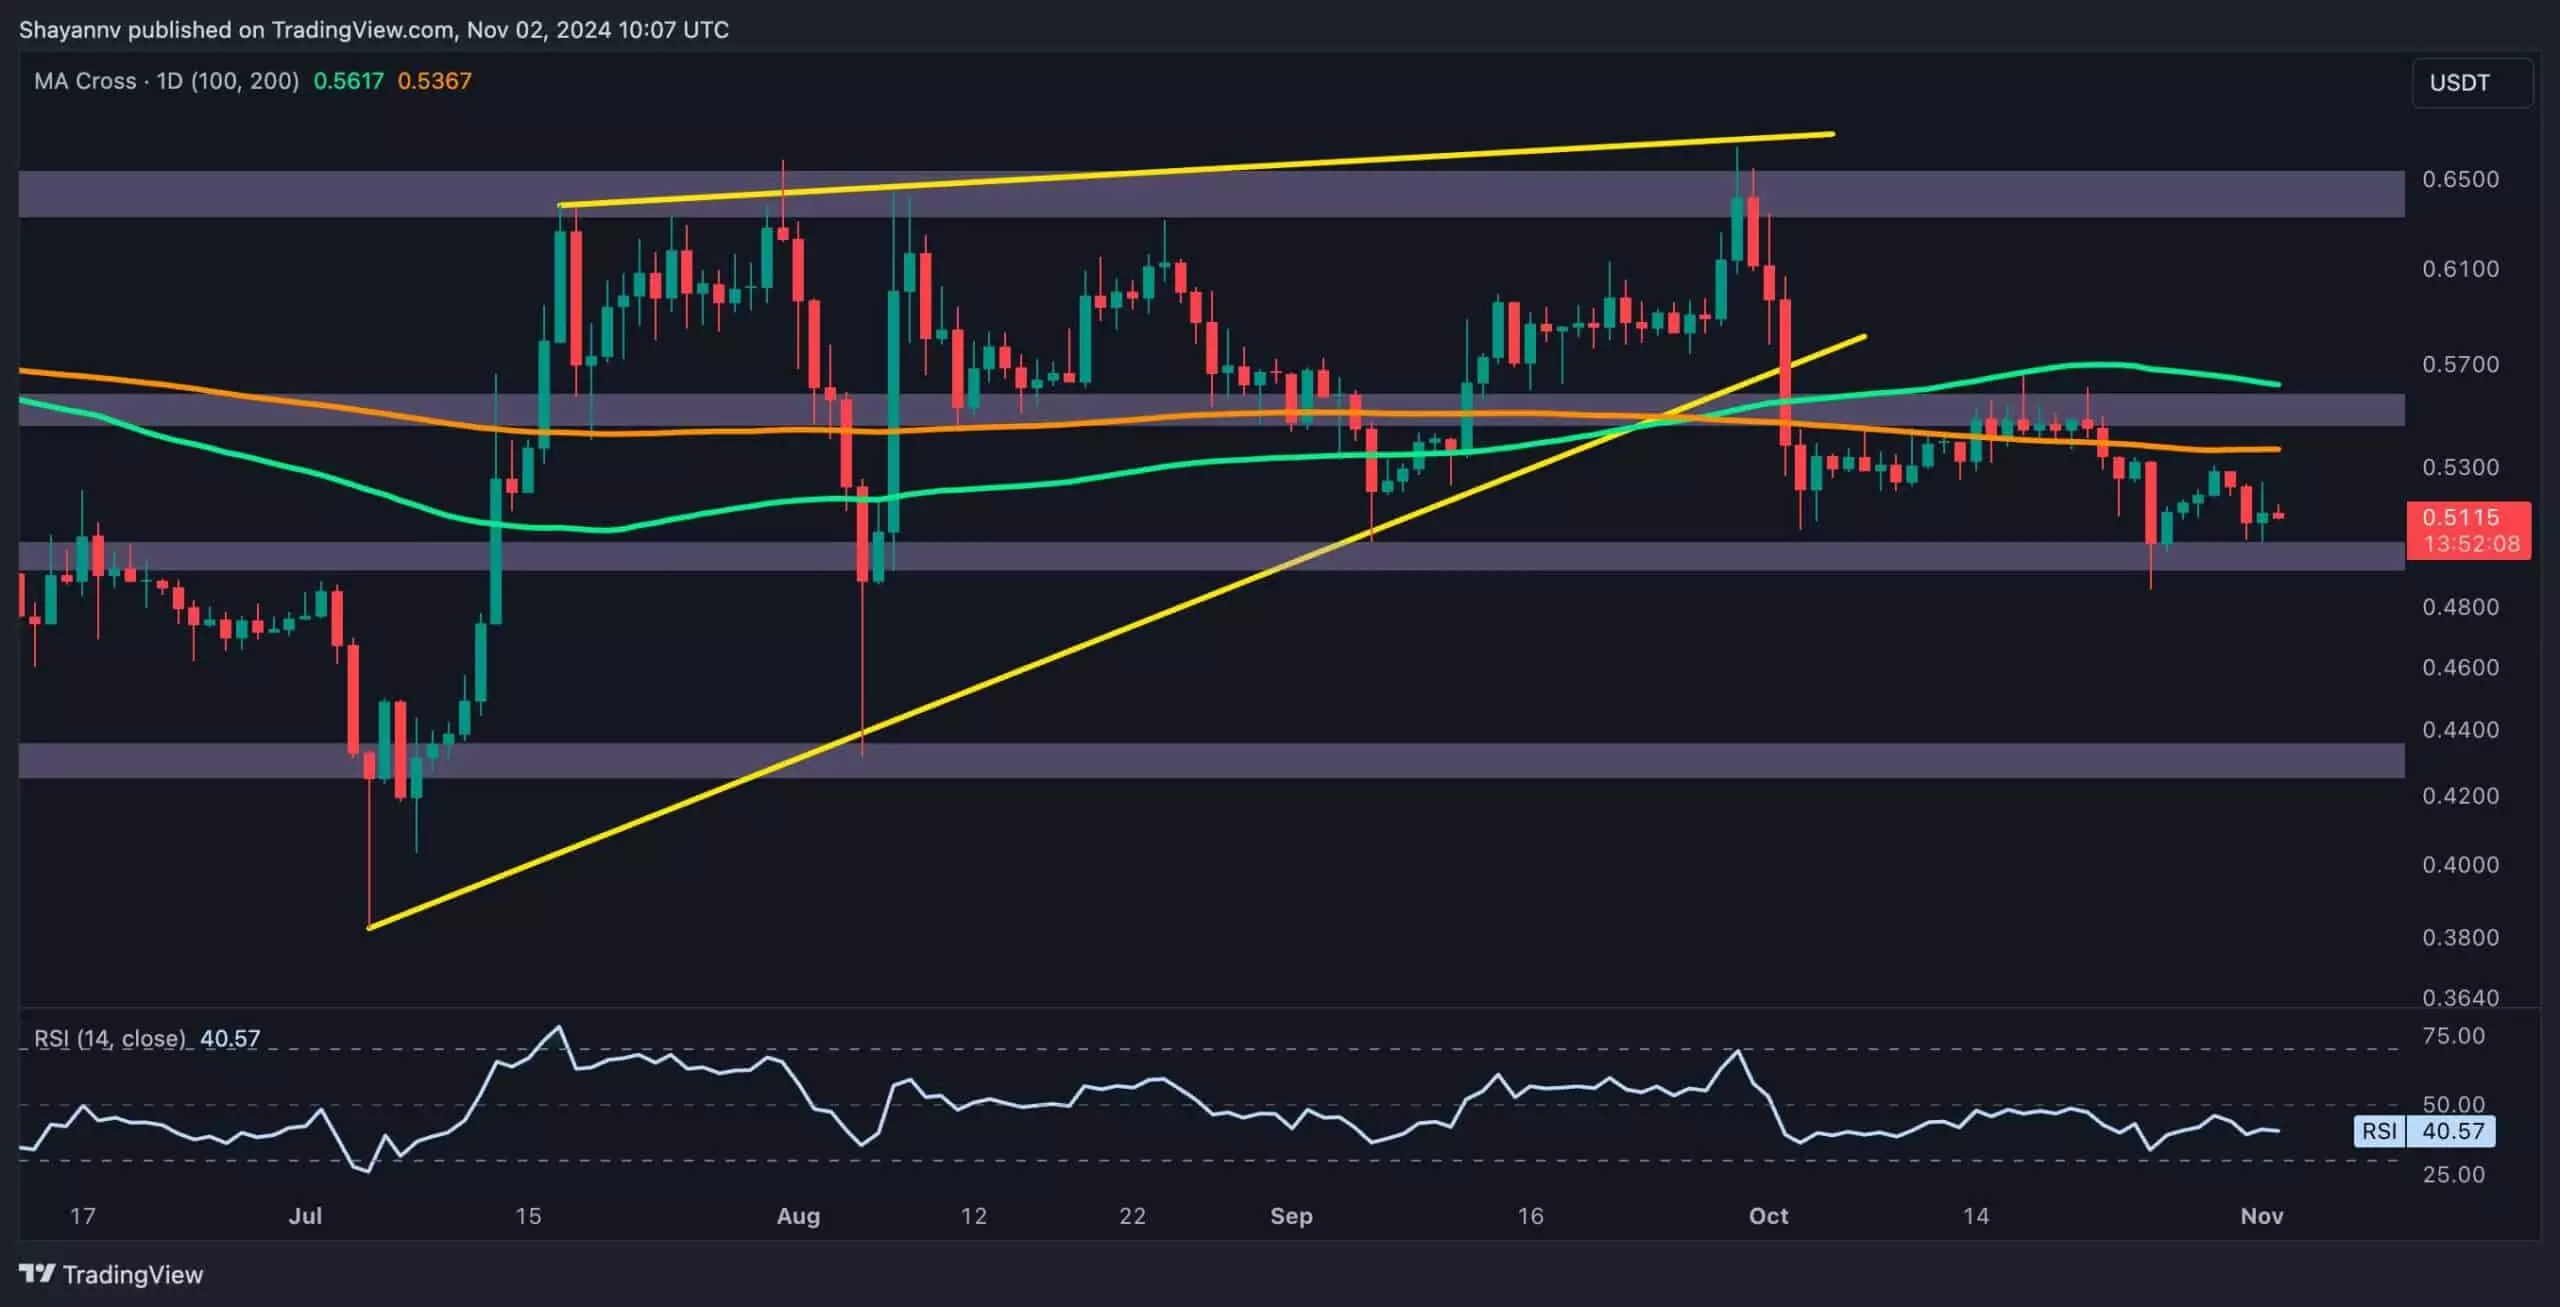
Ripple (XRP) has recently become the focus of attention in the cryptocurrency realm due to its notable price fluctuations, which indicate a prevailing bearish trend. As of now, Ripple has faced significant resistance at the critical 200-day moving average positioned at $0.53. This pivotal level has stymied the upward momentum that XRP had been experiencing, forcing the price to retract and approach the $0.5 support area once again. The sentiment among market observers is tinged with apprehension, as this resistance point raises important questions regarding Ripple’s ability to maintain its position in an increasingly competitive market.
An examination of the daily chart reflects how XRP recently faced selling pressure after a brief uptick toward the elusive 200-day moving average. The sharp rejection at this level has stripped away the prior bullish pressure, compelling Ripple to revert to the $0.5 support zone. Historically, this support level serves as a crucial barrier for prospective buyers, creating a scenario where sellers may seek to exploit weaknesses in this key range. XRP currently fluctuates between $0.5 and $0.53, a narrow range that delineates the immediate future of the cryptocurrency. Traders and analysts alike are scrutinizing these movements, as a breakout or breakdown from this range is likely to determine Ripple’s trend trajectory over the coming weeks.
Delving deeper into a shorter timeframe, the 4-hour chart reveals that Ripple is consolidating within a significant support zone identified by the 0.5 ($0.52) and 0.618 ($0.49) Fibonacci retracement levels. Resistance has manifested around the 0.618 level and the upper boundary of a wedge formation, signifying growing seller activity. The cryptocurrency’s struggle to breach this level raises questions about its short-term performance. Should XRP manage to surpass this resistance, a potential rally toward the $0.55 mark could materialize. However, considering the overall market sentiment leaning toward bearishness, it appears more plausible that Ripple will continue to consolidate or even face a downward trajectory below the $0.5 support.
Looking ahead, a decisive break below the $0.5 mark could initiate a more pronounced and sustained downward trend, shaking investor confidence. As market dynamics continue to evolve, Ripple’s trading behavior in this critical range will be instrumental in shaping its future outlook. Investors would be wise to remain vigilant, as the actions taken at these pivotal levels could have a lasting impact on both short-term trading strategies and long-term investment perspectives. In the cryptocurrency landscape, where sentiment can shift rapidly, understanding these technical indicators is crucial for navigating the choppy waters ahead.


