Recently, Bitcoin has achieved a significant milestone by breaking above the resistance level of $64,000, alongside its 200-day moving average. This breakthrough is indicative of a strong bullish momentum, which many traders and crypto enthusiasts are eagerly observing. The daily chart exhibits a clear upward trajectory, with the Relative Strength Index (RSI) signaling positive momentum. Analysts predict that this upward trend may propel Bitcoin toward the psychological $68,000 resistance zone soon. Such movements are often precursors to all-time highs, as market sentiment shifts favorably.
However, the crypto market remains susceptible to volatility. Traders must remain vigilant, as any corrective move could see Bitcoin retest its 200-day moving average, which is acting as a vital support level at this juncture. Should the price dip below this moving average, it could instigate a more substantial pullback, challenging the prevailing bullish sentiment.
Price Dynamics on Shorter Time Frames
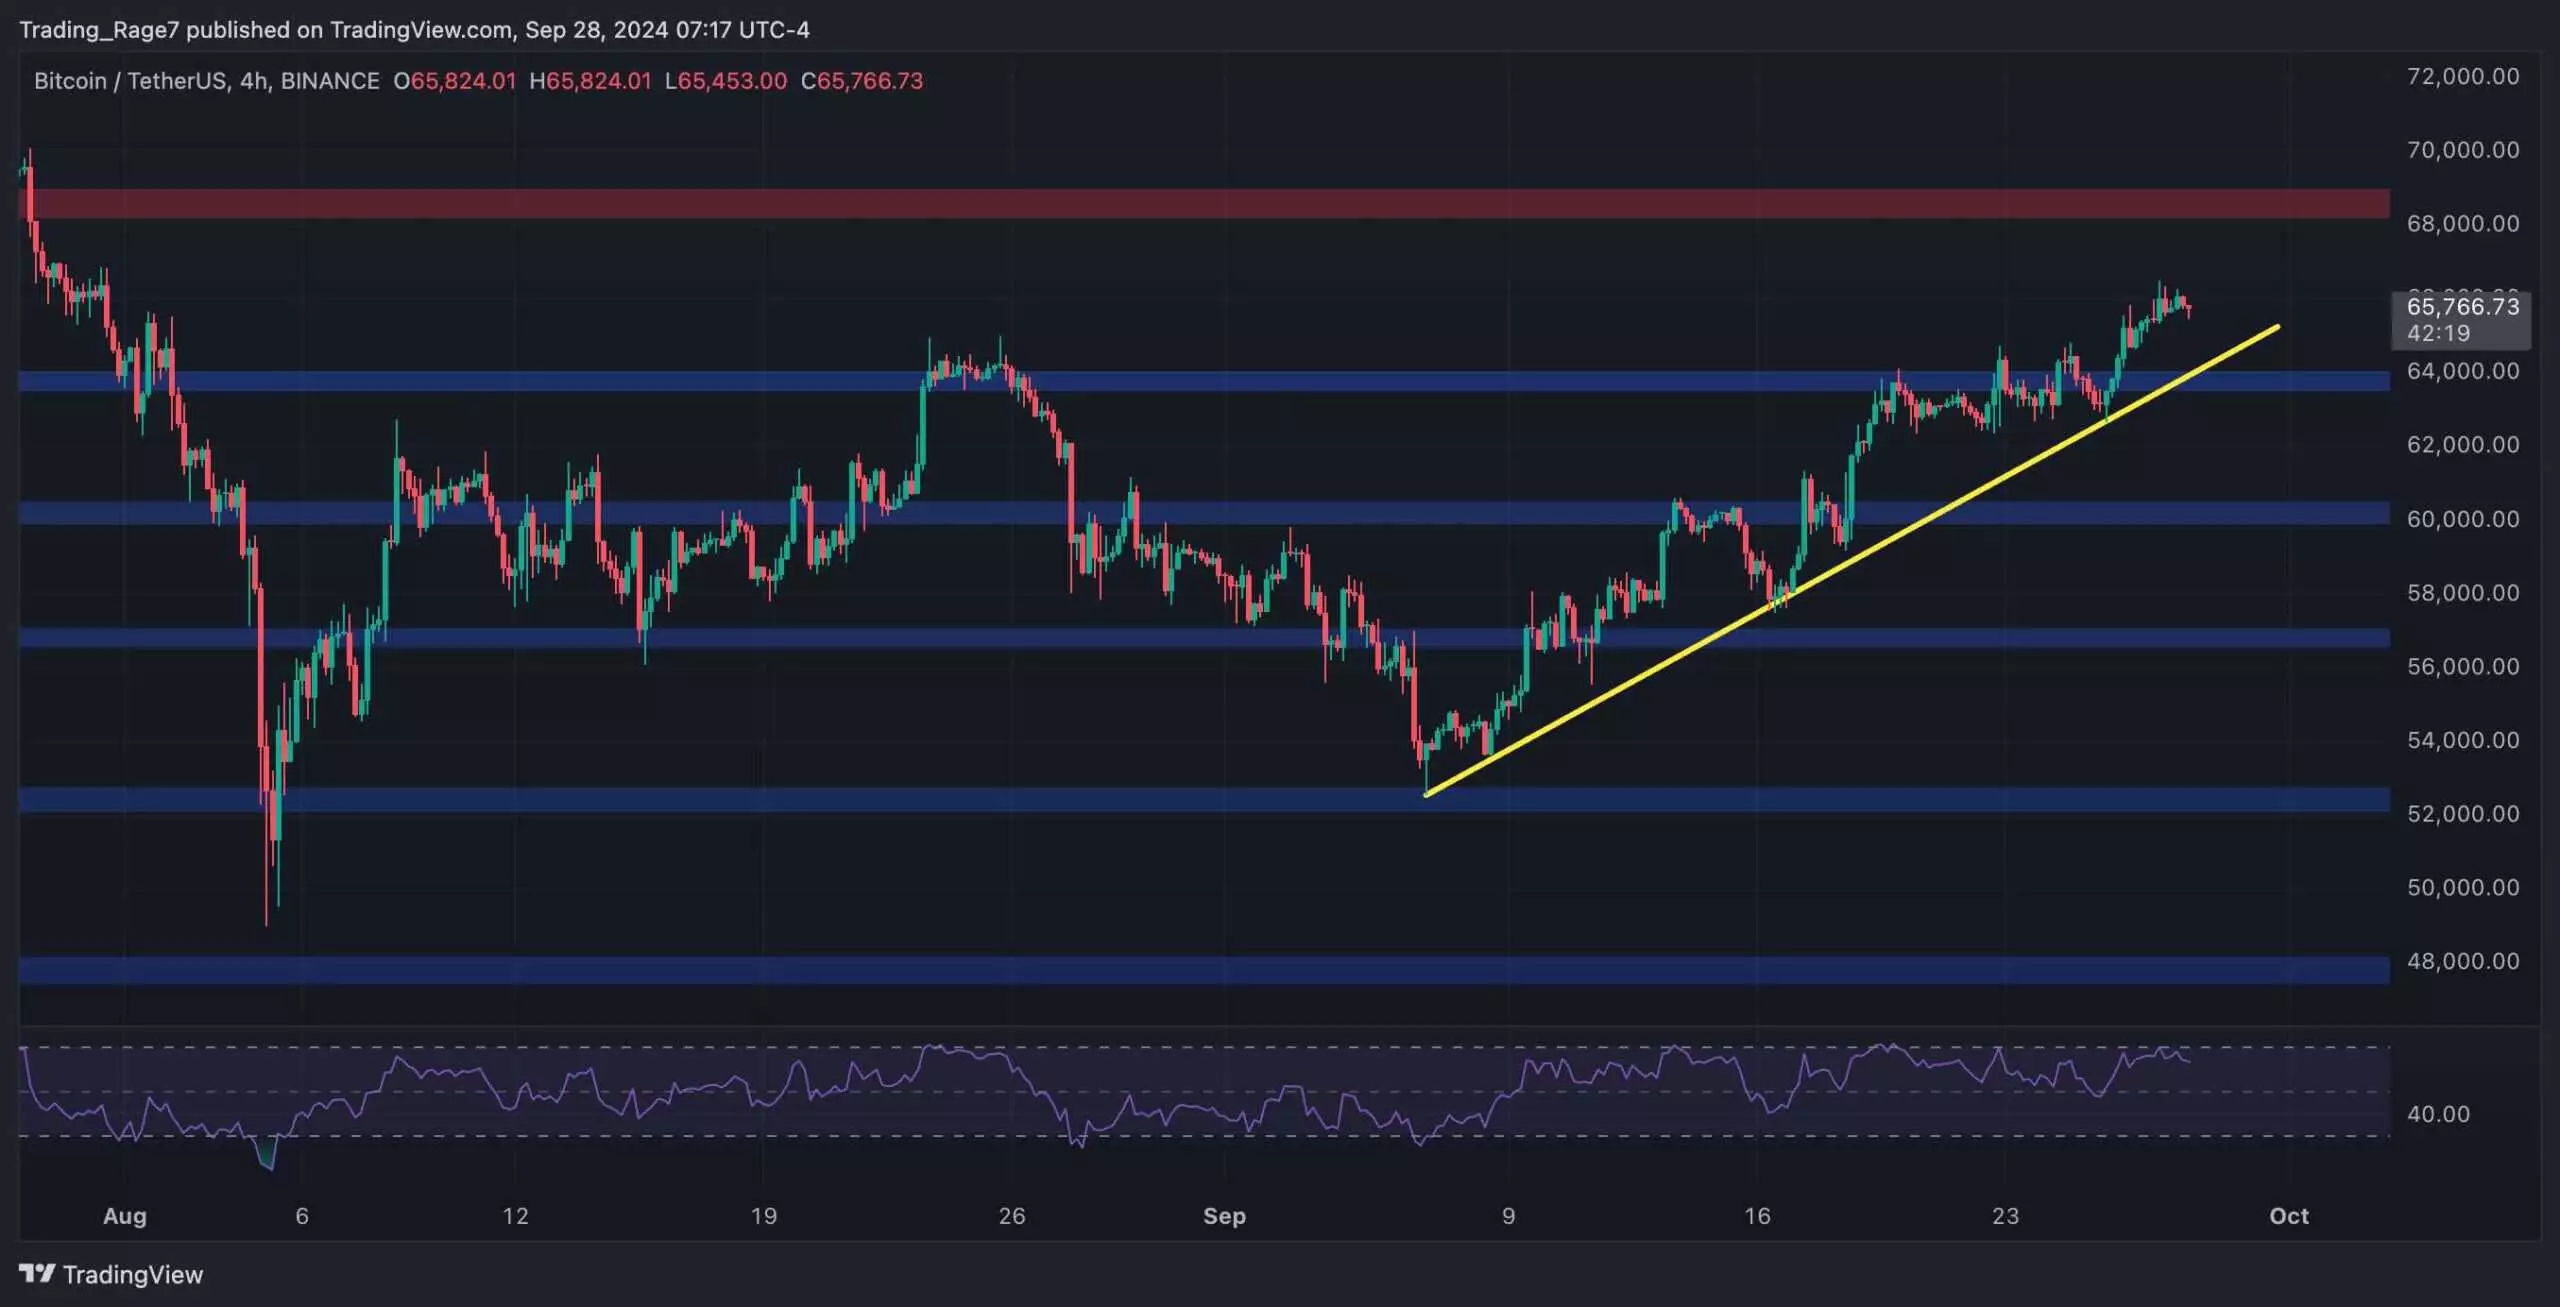
When examining Bitcoin’s price dynamics on the 4-hour time frame, a clear pattern emerges. The cryptocurrency has consistently formed higher highs and higher lows since bouncing off the strong support level at $52,000. This pattern forms a robust bullish trendline that has provided a foundation for ongoing price increases. If Bitcoin maintains this upward momentum and the trendline remains intact, it is plausible that the price will reach the $68,000 target swiftly.
Conversely, a breach of this trendline could signal a shift in market sentiment. A downside break could lead to an immediate pullback, potentially landing Bitcoin at around $60,000. This range will be critical for traders, as it will determine whether the market will rebound back toward its bullish trajectory or if a more profound correction is in play.
Market Sentiment and Short-Term Holder Behavior
Amid these fluctuations, an important facet of market psychology comes into play: the behavior of short-term holders. The Bitcoin Short-Term Holder SOPR (Spent Output Profit Ratio) is a key metric that illustrates the profitability of recent investors. Notably, this measure reached unprecedented levels when Bitcoin initially surpassed the $70,000 mark, reflecting a period of intense buying enthusiasm. However, since then, there has been a marked decline, with many short-term holders forced to sell at a loss as the price corrected.
Recently, as prices have surged once again, some short-term holders are beginning to realize profits, which could further fuel the rally. Yet, this selling pressure could counterbalance the demand, leading to increased volatility if not addressed by strong buying support. The interplay between profit-taking and new buying interest will be crucial in determining Bitcoin’s near-term trajectory.
While Bitcoin’s price has shown promising signs of growth, traders must navigate the complexities of market sentiment and technical patterns cautiously. With significant resistance levels and shifting buyer psychology at play, the forthcoming weeks will be pivotal in establishing whether Bitcoin can claim new heights or if it will encounter further obstacles along its journey.


