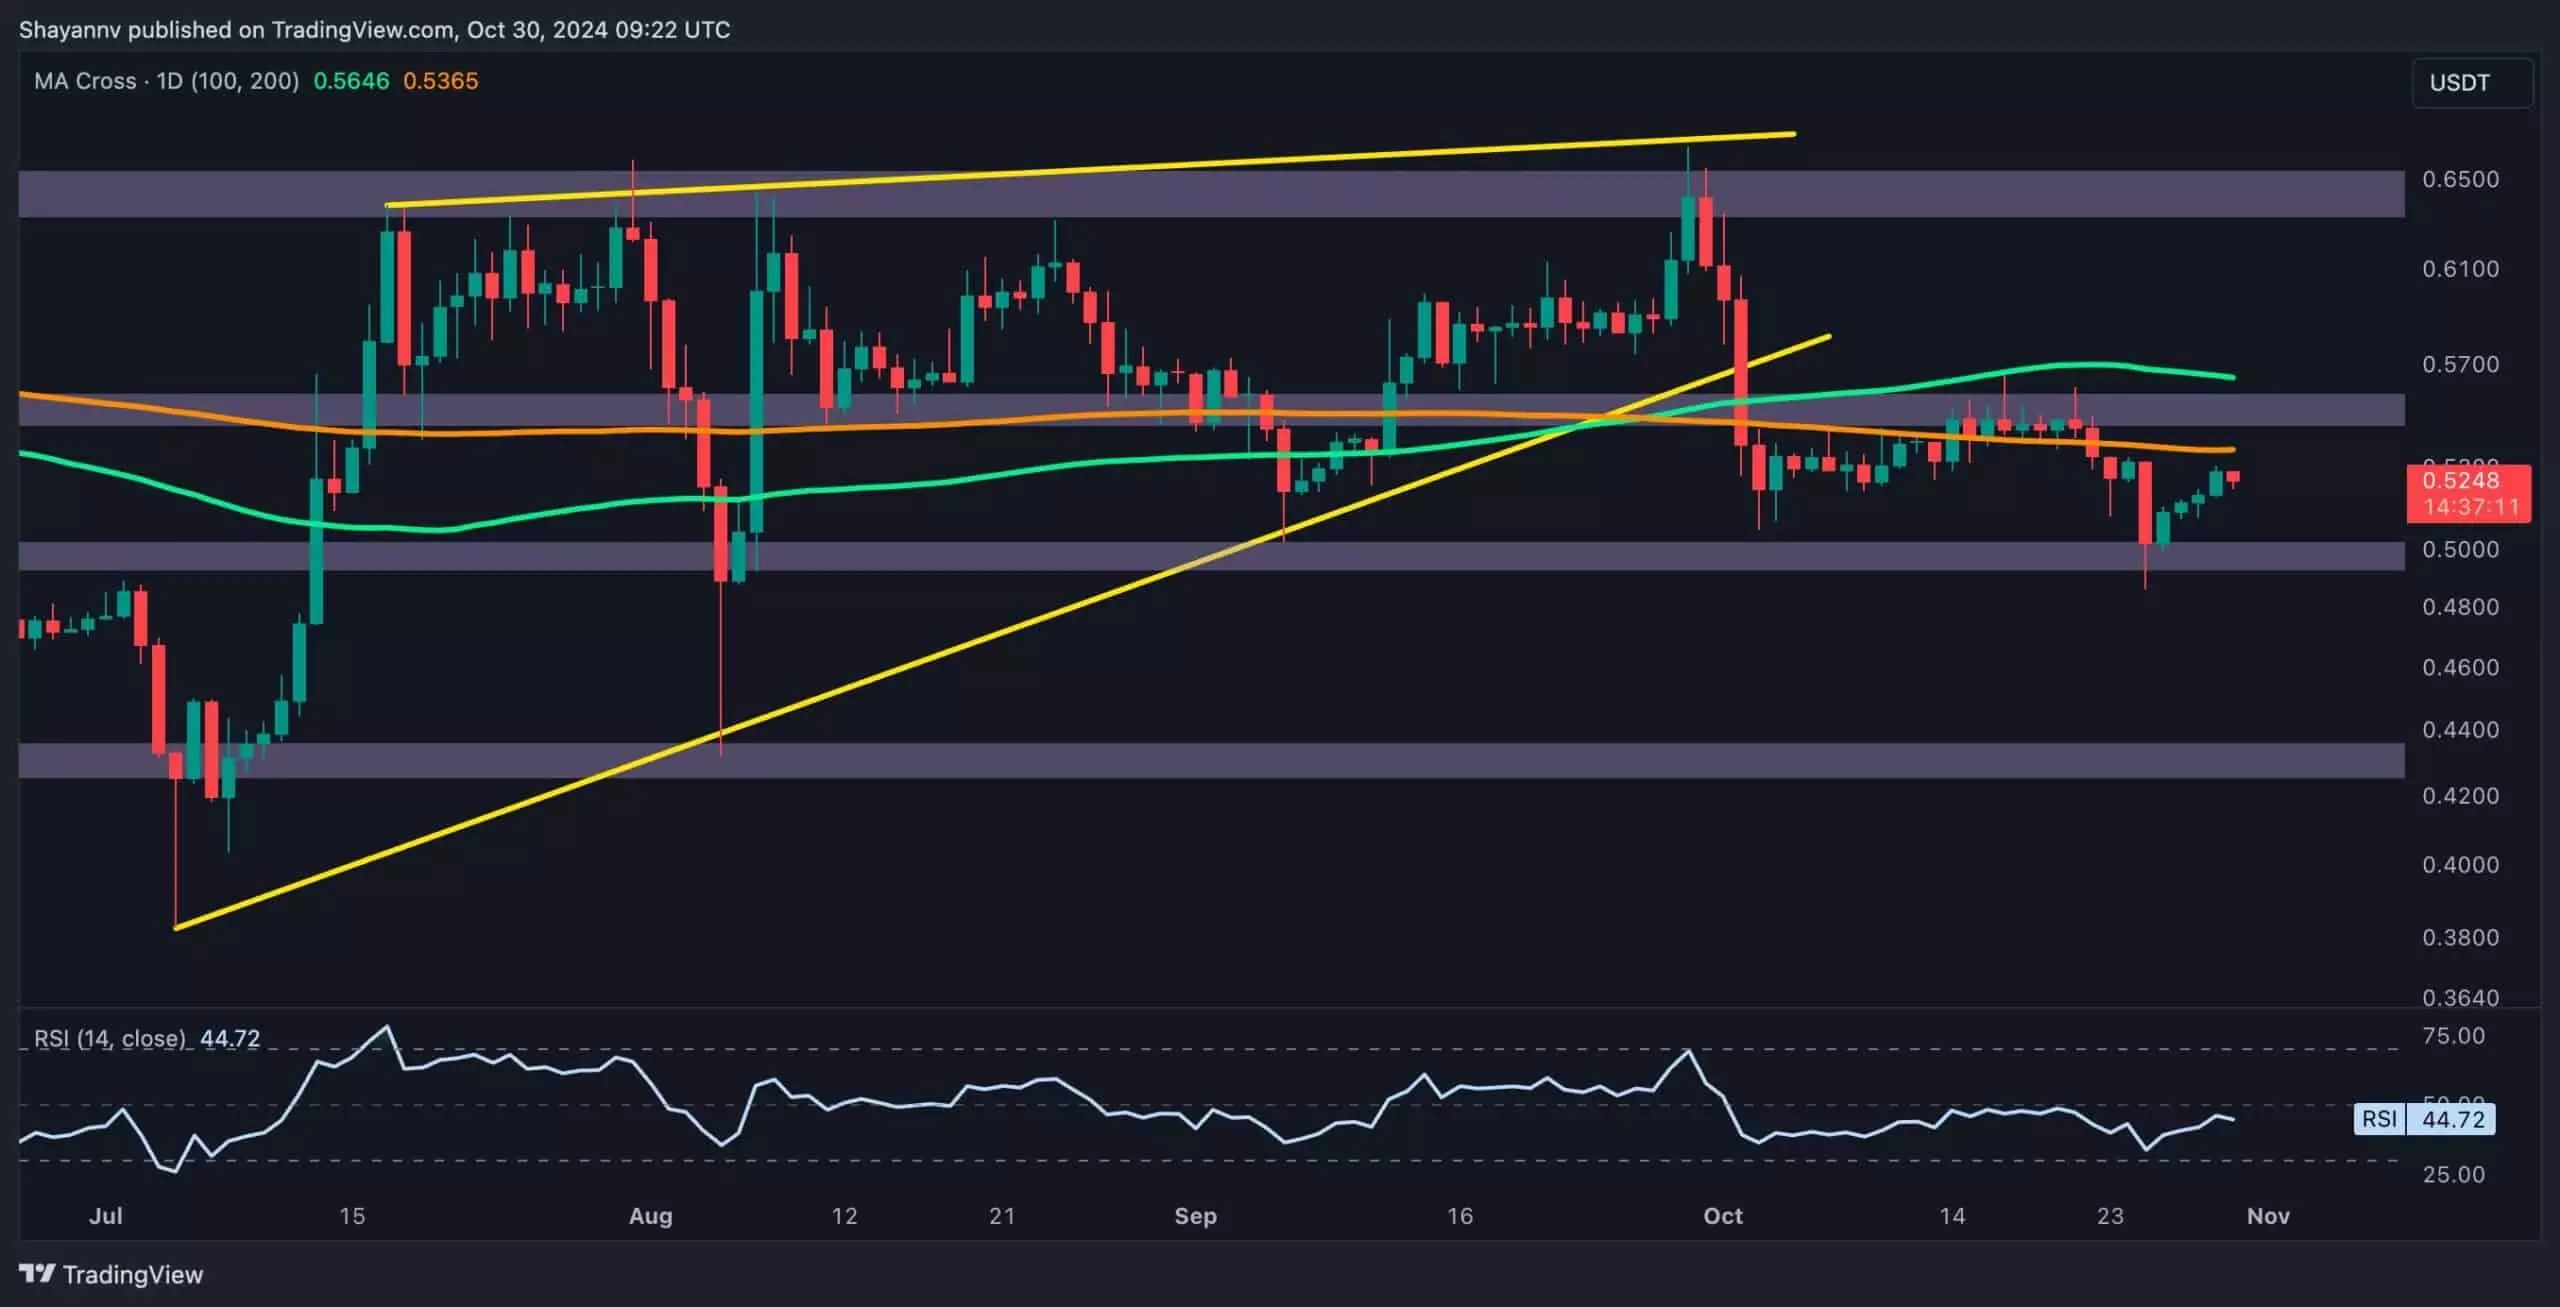
Ripple (XRP) has recently demonstrated a volatile market presence, oscillating between critical support and resistance levels. The cryptocurrency’s price hovers around the significant $0.5 support zone, where it has historically found buying interest. This area remains a focal point for traders watching for signs of bullish or bearish trends. The market exhibits a cautiously optimistic atmosphere; however, the recent price movements suggest that the overall sentiment leans more towards skepticism, particularly with Ripple’s failure to maintain upward momentum.
Technical Indicators and Price Movements
In analyzing the daily trading chart, we observe that XRP has encountered substantial selling pressure. After attempting to rally past the pivotal 200-day moving average, which stands at roughly $0.57, the cryptocurrency faced a strong rejection. This resistance level has historically signified a barrier that sellers capitalize on, thus maintaining the bearish outlook. Should Ripple fail to reclaim this threshold, it could signify a continued decline in price, dragging it below the $0.5 level towards a potential target of $0.46.
The 200-day moving average serves as a critical pivot point for traders, signifying the long-term trend direction. The inability to break through this moving average not only impedes bullish momentum but also amplifies fears of a prolonged bearish phase. Analysts are closely monitoring price actions as a downward breach could indicate a more profound bearish momentum.
Support Levels and Patterns
On a shorter time frame, specifically examining the 4-hour chart, XRP displays a descending consolidation pattern characterized by the defined ranges of support established by the Fibonacci levels of $0.52 and $0.49. This crucial zone has provided a robust safety net for buyers in recent months. Alongside this, the formation of a descending wedge pattern within the $0.49 to $0.52 bracket indicates potential accumulation. Should the price push beyond the upper boundary of this wedge, a breakout could trigger a more significant recovery, potentially targeting the $0.55 resistance level if the market conditions prove favorable.
Yet, the broader market sentiment complicates these potential bullish scenarios. Despite the slight uptick towards the upper boundaries of the wedge, a rejection here could lead to a swift decline back to the $0.5 support, reaffirming the bearish sentiment that has permeated Ripple’s trading landscape.
Ripple currently finds itself at a crossroads, with significant support and resistance levels determining its short- to mid-term price direction. While there are signs of temporary rebounds, the prevailing trend indicates a cautious market that is susceptible to further declines. Investors should watch the $0.5 support level closely as a break below this could lead to more extensive losses, while a successful rally past the 200-day moving average could change the narrative, providing the momentum needed for a bullish recovery. The next few trading sessions are critical in establishing the future trajectory of Ripple in the cryptocurrency landscape.


