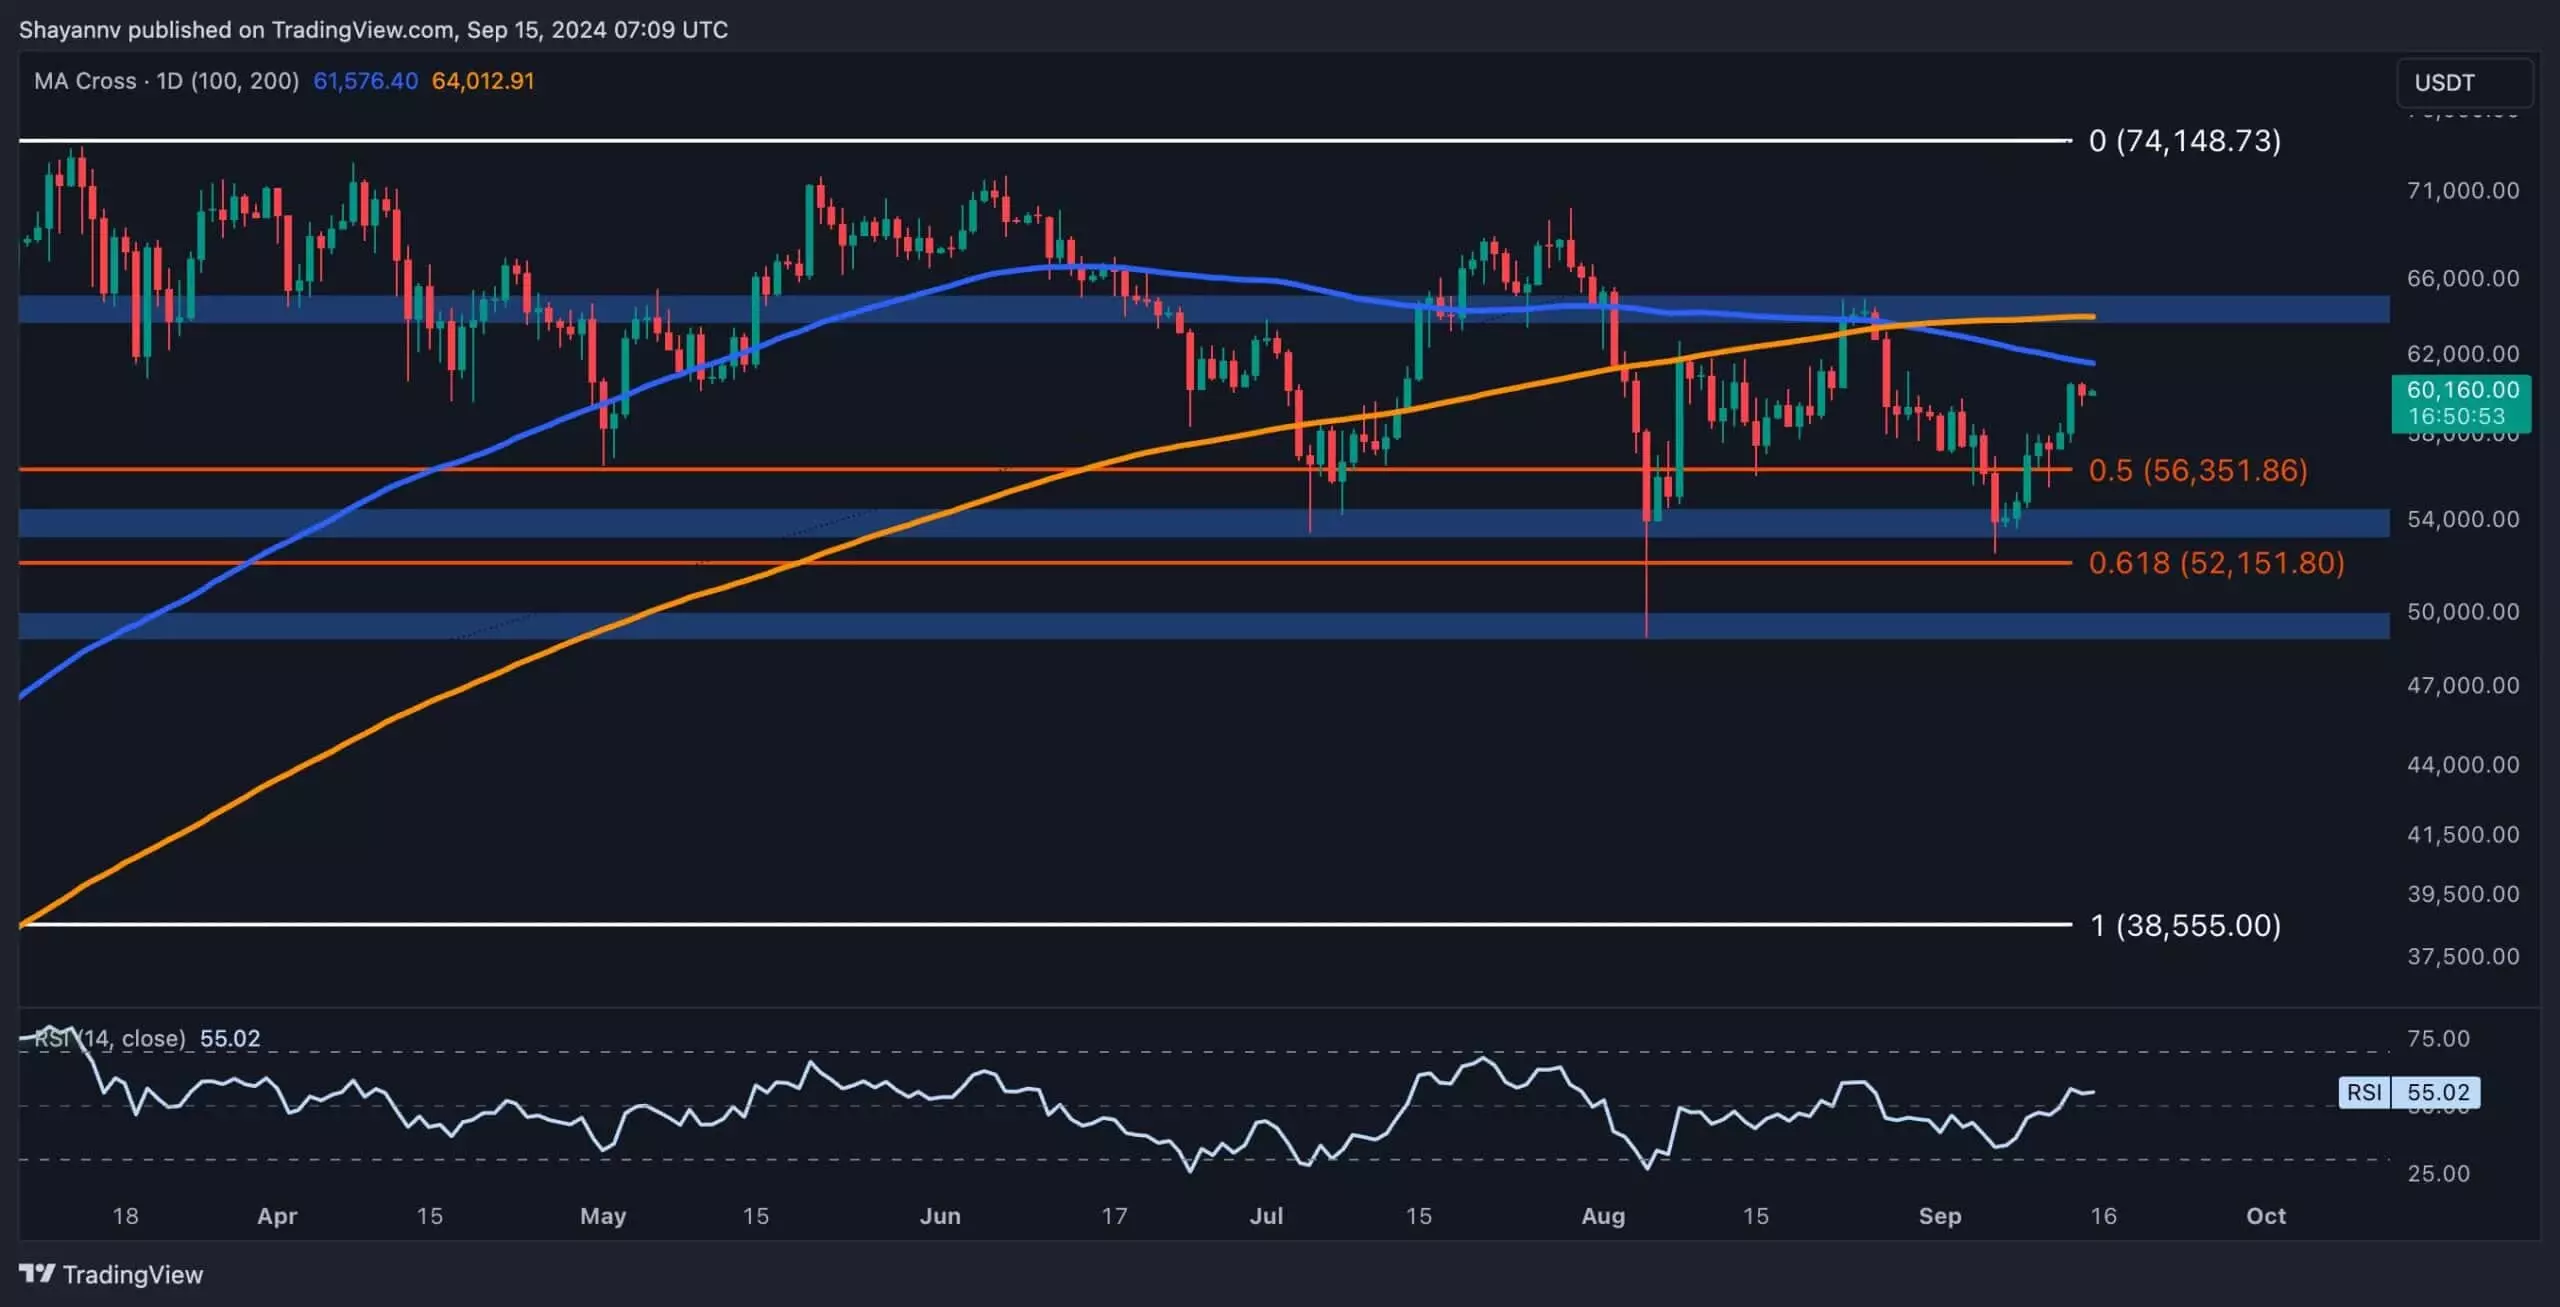
Bitcoin, the pioneering cryptocurrency, has recently been navigating a turbulent sea of price fluctuations. It has demonstrated remarkable resilience, rallying upwards from critical support levels defined by the Fibonacci retracement tool, specifically at 0.5 and 0.618. This reversal is not merely a stroke of luck but rather a reflection of complex market dynamics and investor behaviors.
Bitcoin’s price trajectory has demonstrated a significant bounce back from key Fibonacci levels, specifically between $56.3K and $52.1K. This section of the analysis highlights the importance of Fibonacci retracement, which is employed by traders to pinpoint potential reversal zones. Following a period of bearish movement that saw BTC test these levels, buyers stepped in decisively, allowing for a nearly 15% surge towards the 100-day moving average, located at about $61.6K.
However, while this upward trajectory indicates renewed buying enthusiasm, it also leads Bitcoin directly into a pivotal zone of resistance. The proximity to the 100-day moving average suggests that investors may soon encounter significant selling pressure. This situation sets the stage for a potential consolidation phase, where price oscillations may ensue as buyers and sellers compete for dominance.
The role of moving averages in Bitcoin trading cannot be understated. As Bitcoin approaches the 100-day moving average, traders often look for signals that indicate price direction. A breach above this level could ignite enthusiasm among bulls, pushing the price toward the next resistance level at $65K. Historically, the $65K level has proven to be a considerable hurdle; overcoming it could lead to an even loftier target of $70K.
Conversely, if Bitcoin falters at this point, it might prompt a bearish pullback testing the psychological support zone between $52K-$54K. This push and pull between moving averages and Fibonacci retracement levels exemplifies the precarious balance that traders need to navigate in this rapidly shifting market landscape.
Beyond technical indicators, understanding market sentiment is crucial for assessing Bitcoin’s future trajectory. The Market Value to Realized Value (MVRV) ratio is a vital tool for gauging overall market mood. Calculating this ratio involves comparing Bitcoin’s market capitalization to its realized capitalization, offering insights into whether investors are experiencing gains or losses. A ratio below 1 typically signals that losses are widespread among investors, often indicative of a market bottom during bearish phases.
Recent data suggest that the MVRV ratio has dipped below its 365-day moving average, a significant milestone that historically has also marked the beginnings of recovery periods in the Bitcoin market. For long-term investors, this dip might represent a crucial buying opportunity; however, such enthusiasm must be tempered with caution due to the current climate of fear and uncertainty that looms over the market.
A robust recovery often hinges on the MVRV ratio moving back above this critical threshold. This upward movement not only serves as a confidence booster for investors but also reinforces the possibility of a market turnaround. Yet, the lingering sentiments of caution remind investors that patience will be crucial in navigating through these turbulent times.
The outlook for Bitcoin remains multifaceted, characterized by pivotal resistance levels and fluctuating market sentiment. The cryptocurrency has displayed bullish tendencies following critical support testings, yet it faces imminent challenges as it approaches key moving averages and resistance zones. For investors, the balance between optimism and caution is vital.
While potential upside exists, with the $70K mark looming on the horizon, the current market environment demands a level-headed approach. The indicators at play, including Fibonacci levels and MVRV fluctuations, necessitate rigorous analysis and a willingness to adapt swiftly to changes in market dynamics. As such, whether the trajectory is bullish or bearish will heavily depend on the market’s collective sentiment and the effective navigation of these complex trading terrains.


